CODAE architecture
Translation- and rotation-equivariant encoder
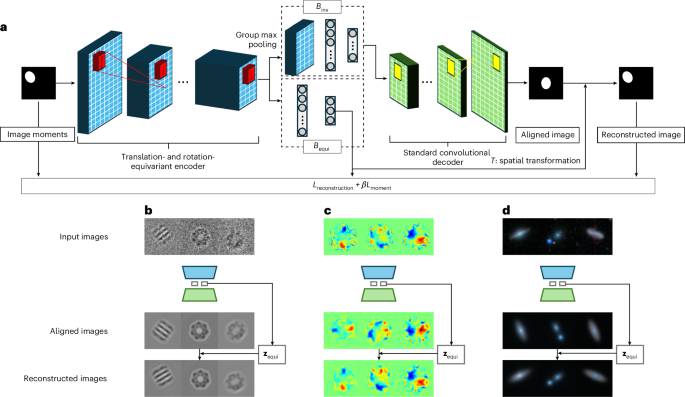
CODAE uses a translation- and rotation-equivariant encoder, denoted by Eϕ, that utilizes group-equivariant convolutional layers. These layers apply convolutions with stacks of rotated kernels at equally spaced orientations, enabling the encoder to capture both translational and rotational equivariance in a manner that is analogous to the continuous operation described by Theorem 2 in the Supplementary Information. Following these equivariant layers, the encoder divides into two branches to process either translation- and rotation-equivariant or invariant features. The first branch, denoted by Bequi, is followed by fully connected layers and is specifically designed to learn centroid and orientation factors. The feature maps in Bequi maintain the same patterns of objects by preserving their centroids and orientations through the equivariant layers, as established by Theorem 2. This allows Bequi to capture centroid and orientation factors effectively. The second branch, denoted by Binv, is followed by a group max-pooling layer and fully connected layers. The max-pooling layer enables the learning of features invariant to translation and rotation, as established by Theorem 3 in the Supplementary Information, allowing Binv to capture invariant semantic representations. By separately learning centroids and orientation in Bequi and invariant representations in Binv, CODAE outputs both aligned reconstructions and the same view images. The proposed network architecture and example reconstructions from three scientific domains are shown in Fig. 1. Please see Methods for model details.
a, An Illustration of CODAE architecture. The model includes two arms and the spatial transformation to learn centroid, orientation and other features effectively. b–d, The examples of reconstruction of aligned and the same view images of the EMPIAR-10029 (b), graphene CBED pattern (c) and Galaxy-Zoo datasets (d).
Image moment loss
Although the concept of moments was initially introduced in the context of statistics, it has been widely applied in computer vision12,13,14. Moments, which initially describe the distribution of data points, can capture essential features and characteristics of images, including the centre of mass (COM) and orientation of objects. Although image moments capture the centroid and orientation features with a high degree of accuracy, they can still have a degree of subtle inaccuracy. Therefore, we utilize the image moments as guiding principles during the initial stages of learning. Consequently, the loss objective function of CODAE includes the reconstruction loss and image moment loss. To investigate the impact of the image moment loss specifically, we train CODAE with only reconstruction loss. The ablation study in Supplementary Table 4 shows that the image moment loss encourages learning x and y positions and orientations from Bequi. Gradually decreasing the strength of the image moment loss using a hyperparameter, β, during the training, CODAE refines inaccurate centroids and orientations from the image moment. Please see the details of image moments in Supplementary Section A.2.
Semantic representation learning using CODAE on scientific datasets
To show the capability of learning the semantic representation of CODAE, we test CODAE on publicly available scientific datasets and visualize the latent traversals by varying the values of the target dimension in the latent space while fixing the values in the other dimensions to show individual features that the model has learned.
First, we study a simulated cryo-EM dataset (EMPIAR-10029) of GroEL particles, representing the 2D projection images of this specimen imaged using the single-particle analysis approach. The cryo-EM single-particle analysis technique produces low signal-to-noise 2D projection images where the 3D orientation of the molecule or object producing those orientations is unknown. By identifying 2D projections of the molecule taken from similar viewing directions (or object poses) and aligning them through in-plane rotations and translations, one can average these projections. This process amplifies the signal-to-noise ratio to a level suitable for 2D image analysis. Once in-plane rotations and translations are known with sufficient accuracy, out-of-plane object rotations, which produce projections of the molecule in different poses, may be explored in 3D. The averaging of accurately aligned particle images increases the signal-to-noise ratio to reconstruct high-resolution 3D cryo-EM density (Coulomb potential map)15. The latent traversal of CODAE shows variations of the particles such as (x, y)-positions, in-plane orientations, background and out-of-plane orientations (pose) (Fig. 2a). Importantly, the pose representation shows different 2D projections or out-of-plane representations of the 3D molecule. This demonstrates that CODAE could enable image alignment to a reference to perform 3D reconstruction of cryo-EM images or provide priors to other cryo-EM reconstruction refinement algorithms.

a–c, Reconstructions of latent traversals across each latent dimension obtained by CODAE for the EMPIAR-10029 (a), graphene CBED pattern (b) and Galaxy-Zoo datasets (c).
To explore the flexibility of CODAE, we next focus on experimental graphene convergent beam electron diffraction (CBED) patterns, where only orientation learning is required, and an alternative to image moments is available. The 4D-STEM technique maps the internal Coulomb potential of a crystal and produces a CBED pattern at each incident electron probe position. The information encoded in the rotational alignment of these patterns includes crystalline orientation and polarization2,16. Experimental CBED patterns are typically centred as a preprocessing step, making it unnecessary to learn (x, y)-positions from the Bequi branch. In addition, we use the COM to estimate the approximate orientation of CBED patterns rather than image moments, as this is a common approach in CBED pattern analysis, as noted in ref. 2. This differs from cryo-EM and galaxy images, where both centroid and orientation variables are learned and compared with approximated centroids and orientations derived from image moments. Following the previous study in ref. 2, we chose a 4D latent space and used the Pearson correlation coefficient of the latent features with (x, y)-components, angle and magnitude of the COM, denoted as COMx, COMy, COMangle and COMmag to identify the features learned by CODAE. If the coefficient is less than 0.5, we labelled them as an unnamed feature. By separately learning orientations, Binv encodes invariant features that exhibit COMx, COMy and COMmag, and the decoder visualizes changes in both Bequi and Binv within real space (Fig. 2b). In addition to the latent traversal, Supplementary Fig. 6 shows the corresponding diffraction patterns, which are proportional to the electric field map that electrons experience as they pass through samples, for each feature, along with the Pearson correlation coefficient. CODAE enables exploring latent features in CBED data beyond the orientation and magnitude typically captured by COM-based methods.
Finally, we explore CODAE on the Galaxy-Zoo dataset. From the Galaxy-Zoo project, many galaxy images became available17. As the number of available galaxy images increases, manually annotating these images becomes impractical. Furthermore, the properties of galaxy images remain unchanged by their orientation, which motivates the need for an unsupervised approach to align galaxy images and to learn their semantic representations. In this study, we demonstrate the performance of CODAE using images of 314,000 galaxies from the Galaxy-Zoo dataset18. Figure 2c shows that CODAE can visually uncover the dataset’s critical features, such as size, colours, shape, separation and background, by separately learning (x, y)-positions and orientations. While we provide a visual interpretation of each dimension learned by CODAE in the Galaxy-Zoo dataset, future directions include conducting an in-depth analysis of each latent dimension. This would involve considering galaxy-specific characteristics, such as variations in angular size due to different distances from Earth. Such analysis could further enable CODAE to capture both intrinsic galaxy properties and observational variations, enhancing its utility in galaxy morphology studies.
Our findings demonstrate CODAE’s remarkable ability to learn semantic representations across three diverse scientific datasets, where objects can be freely translated and rotated. This underscores CODAE’s efficiency and highlights its potential to revolutionize understanding and analysing complex scientific data.
Comparison with other approaches on simulation and scientific datasets
In recent years, encoder–decoder-based architectures have emerged, using spatial transformations to translate and rotate grids in latent space and generating images corresponding to the transformed grids using latent variables. We use two types of evaluation methods: (1) numerical scores on two synthetic datasets, namely, XYRCS (described in detail in Methods) and dSprites datasets7,19, to quantify the capability of models to disentangle features, including (x, y)-positions and orientations, and (2) visualization of aligned images from input images on the two synthetic and three scientific datasets to qualitatively assess alignment consistency. To ensure a fair comparison, we train each model with different random 20 seeds and report the highest total score over these metrics.
Numerical scores
We report the eight supervised disentanglement metrics on the XYRCS and dSprites datasets (see Methods for datasets and metrics details). Figure 3 shows the evaluation metrics of six encoder–decoder-based neural networks, namely, disentangling autoencoder (DAE)7, β-variational autoencoder (VAE)6, spatial-VAE1, target-VAE10, invariant representation learning with implicit neural representation (IRL-INR)11, and our proposed model, CODAE. DAE and β-VAE are not explicitly designed to learn centroids and orientations. Besides, spatial-VAE, target-VAE and IRL-INR are proposed to use spatial transformation in the latent space to learn centroids and orientations (Methods; Supplementary Section A.1 includes details of CODAE and baselines). In both datasets, we set a five-dimensional latent space in DAE and β-VAE and a 2D latent space in the other models because the other models explicitly learn (x, y)-positions and orientations. We report the disentanglement capability of models with and without positions and orientations. Measuring disentanglement scores with positions and orientations offers insights into the capability of fully semantic representation learning. Then, positions and orientations are identified among five features and excluded to measure disentanglement scores. These scores give insights into the capability of learning patterns and structures independent of positions and orientations. When considering the average of all metrics, CODAE substantially outperforms baselines. For the XYRCS dataset, target-VAE performs as well as CODAE with all features, while spatial-VAE exhibits a similar level of performance to CODAE in colour and shape feature learning. For the dSprites dataset, CODAE outperforms all models across all metrics when all features are considered. With only scale and shape features, it outperforms the other models except for the z-var (described in Methods) score. However, the difference between the best performance and the performance of CODAE in the z-var score is marginal and negligible.

a–d, The eight supervised disentanglement metrics of six models on the XYRCS dataset with (x, y)-positions and orientations (a), the dSprites dataset with (x, y)-positions and orientations (b), the XYRCS dataset without (x, y)-positions and orientations (c) and the dSprites dataset without (x, y)-positions and orientations (d).
Visualization of aligned images from input images on two synthetic and three scientific datasets
We use (x, y)-positions and orientations, which are identified after training, to investigate further the capability of learning centroids and orientations of models to generate aligned reconstruction across images in a dataset. As shown in Fig. 4, DAE and β-VAE struggle to align them in the XYRCS and dSprites datasets without alteration. Meanwhile, for the XYRCS dataset, CODAE and spatial-VAE perfectly align all objects. Target-VAE cannot align the squares, and IRL-INR faces difficulties keeping shapes when the object is either a circle or a rectangle. For the dSprites dataset, while CODAE aligns images by preserving their scale and shape, the other models fail to align heart images except for target-VAE. The scientific datasets lack ground-truth factors, making it difficult to manually identify or verify (x, y)-positions and orientations. For this reason, we report the aligned reconstructions of the EMPIAR-10029, experimental graphene CBED patterns and Galaxy-Zoo datasets for only CODAE, spatial-VAE, target-VAE and IRL-INR models. First, in the EMPIAR-10029 dataset, CODAE, spatial-VAE and target-VAE can reconstruct visible and aligned images compared with IRL-INR as shown in Fig. 4c. Next, Fig. 4d shows that spatial-VAE and target-VAE align images with the same orientation but fail to reconstruct the original graphene CBED patterns. Although IRL-INR outputs different patterns based on the inputs, the aligned patterns are not as sharp as those reconstructed by CODAE. Finally, Fig. 4e shows that the aligned galaxy reconstructions produced by CODAE are visually better than those of other models, especially when two galaxies are present in the image. Although CODAE outperforms the others, it still smooths the galaxy structure. This smoothing results in a loss of complex structures, but it is worth noting that it may be beneficial for approximating symmetric light profiles for galaxies.

a–e, The visualization of aligned images from input images on the XYRCS (a), the dSprites (b), the EMPIAR-10029 (c), the graphene CBED patterns (d) and the Galaxy-Zoo datasets (e). The aligned reconstructed images are generated by each model using the centroids and orientations learned from the model.
Our work revealed that, while most models can reconstruct aligned images in the XYRCS, dSprites and EMPIAR-10029 datasets, the CODAE model stands out as the only one that aligns input images with high quality in the graphene CBED pattern and Galaxy-Zoo datasets. In addition to the aligned reconstruction of each model, latent traversals of all models are included in Supplementary Section A.3.